Results
Data Analysis
For the first summary statistic, we looked at the difference in the before and after measurements in two different contexts. First, we looked at the overall difference in wildlife activity strictly between the four different deterrence mechanisms (Figure 3). Through this analysis, we can clearly see that there is a dominant deterrence mechanism in successfully reducing the wildlife presence near and around both roads and railways. Overall, when looking at the percent differences between the success of each deterrent, the control actually had an increase in wildlife occurrence of 4%, the auditory deterrent had a 29% decrease in wildlife activity, the visual deterrent had a 37% decrease, and lastly, the auditory and visual combination had the most success with a 67% decrease in wildlife activity.

Figure 3. The percent decrease between before and after wildlife activity measurements
The second context in which we analyzed the difference between the before and after measurements in relation to the four deterrence mechanisms in terms of which was more effective at roads or railways (Figure 4). Additionally, we also analyzed the overall success in deterrence in terms of all mechanisms at roads and railways to see which location has a better reduction in wildlife activity. In terms of looking at whether or not the deterrents were more effective at roads or railways, there was a 28% decrease in wildlife activity near roads and a 26% decrease at railways. So in terms of which location is better suited to decrease wildlife activity in terms of our four different deterrent applications, the deterrence at roads was slightly better.

Figure 4. The percent decrease of before and after wildlife activity measurements in relation to roads versus railways
In addition, we analyzed the overall percent decrease of each deterrent when segregated by roads and railways (Figure 5). This was done to determine if a certain type of deterrence mechanism performs better when placed at either roads or railways. First when looking just at roads, there was a 7% increase in wildlife activity when the control was enabled, a 29% decrease in wildlife activity when the audio deterrent was enabled, a 21% decrease when the visual deterrent was enabled, and a 57% decrease when the combination of both audio and visual deterrent was enabled. Now for the railways, there was a 2% increase in wildlife activity, a 18% decrease in wildlife activity with the audio deterrent, a 33% decrease with the visual deterrent, and then a 64% decrease with the combination of both an audio and visual deterrent.

Figure 5. The percent decrease in before and after wildlife activity measurements in relation to each deterrence mechanism on roads versus railways
Statistical Analysis
Due to the nature of our data, we decided to conduct two different statistical analyses that will compare both our before and after measurements, as well as the effectiveness of each deterrent.
|
1) Paired T-test
|
First, to compare our two-sample data for our before and after measurement we conducted a paired t-test in R. The reason for doing this was to determine if there are any significant variations among the before and after measurements in order for us to determine whether or not the deterrents actually decreased wildlife activity. The t-value that results from the paired t-test (6.9; Figure 6) reveals that there is a significant variance between the before and after data. Because we have confirmed that there is indeed an effect of the deterrents on wildlife activity, we wanted to see just how big this effect was. To do this we conducted our second statistical analysis with the use of effect size statistics in R.
Figure 6. Paired t-test output from R

|
|
2) Effect Size
|
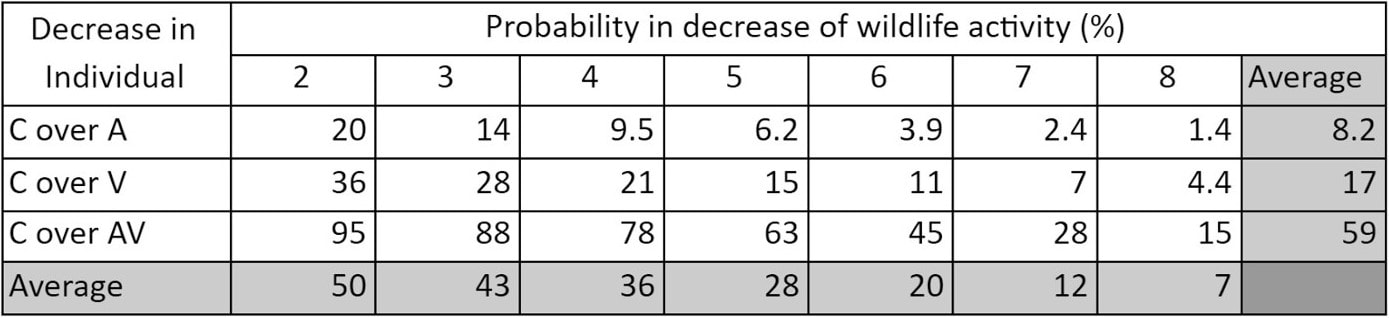
For this, we wanted to see how effective each deterrent was in reducing a set number of wildlife individuals in reference to the control. We decided upon a predetermined range of decrease of a reduction in two to eight wildlife individuals. Each deterrent was compared to the control and the success rate was determined based upon the ability for that deterrent to actually result in a decrease in wildlife activity. From the results of the effect size statistics (Table 2), we can see an overall general trend in effectiveness of all the deterrents combined to decrease wildlife activity. These general trends can be observed by the averages in the bottom row. As more and more wildlife individuals are decreased from the overall wildlife activity, the probability of that decrease occurring declines (i.e. probability of decreasing 2 individuals is 50% whereas the probability of decreasing 5 is 28% and the probability of decreasing 8 is 7%). Additionally, from the averages of each deterrent in decreasing wildlife in relation to the control (i.e. audio, visual, and audio+visual deterrent), these numbers follow suit with the result depicted in Figure 3. Again, this further reinforces the success with which the audio+visual deterrent combination (59%) has over just the audio (8.2%) and just the visual deterrent (17%) alone. Then when looking specifically at each deterrent in isolation of each other in reaction to the predetermined range of decrease in wildlife individuals, there are some additional results that can be extrapolated. With the audio deterrent (row labelled “C over A”), there is a very minimal decline in probability of decreases with only a ~19% difference between the decrease in two individuals versus eight individuals. Whereas for the visual deterrent (row labelled “C over V”) and the audio+visual deterrent (row labelled “C over AV”) there are much more drastic declines. The visual deterrent declines ~32% between a decrease of two wildlife individuals to eight, and the audio+visual deterrent declines ~80% between a decrease of two wildlife individuals to eight.
Table 2. Effect size statistics outputted results for the probability of achieving a predetermined decrease in wildlife activity
|
Discussion
From our results, we see that the most effective type of deterrent mechanism is the combination of both the audio and visual deterrent. This result was as expected, as we predicted that the more deterrents that are present, the more effective they would be. The deterrent at railways showed slightly greater success than the deterrents at the roads. This is likely due to the fact that trains are seen less frequently than vehicle traffic and because trains are bigger and more loud than vehicle traffic so collisions are already less likely to occur (Barrientos, 2019).

From our results, we can see that the audio deterrent is 11% more effective when placed at a road over a railway. Animals are more accustomed to loud noises around train tracks, as the trains themselves are louder than vehicle traffic. The visual deterrent is 12% more effective when enabled at a railway versus a road. This is likely due to wildlife being used to seeing many more moving vehicles on the highway than trains on the railway (McClure, 2013). Often it is seen for animals to react to audio deterrents by running across the train tracks, which can result in collisions (Babińska, 2015). Our results concur with this as the visual deterrent was more effective at the railway versus the road. This shows that the wildlife by highways are used to moving objects, therefore making the visual deterrent less effective by highways. Lastly, the audio and visual combination was only slightly more effective (3.1%) at a railway versus a road. Since two out of the three deterrents (excluding control here) were more effective at railways over roads (visual and the audio and visual combination), we can infer that based on our deterrence types, wildlife deterrents are ~60% more effective when placed at railways versus roads.

Furthermore, due to the addition of the control deterrent, we were able to successfully catch annual fluctuations in wildlife activity as the control deterrent returned a percent increase in wildlife activity as opposed to a percent decrease as was seen with the other deterrents. Wildlife managers can use the results from the effect size statistics (Table 2) to determine which deterrent to use based on the time frame they have and the amount of decrease in wildlife activity they want. For a lower decline in probability of decrease, but a relatively consistent decrease, the use of an audio deterrent is most effective. For a medium, average decrease, the visual deterrent is most effective. Lastly, for a higher, immediate decrease, the combination of an audio and visual deterrent is most effective. By using these results, wildlife managers can determine the success with which they could reduce wildlife activity.
