Project Description & Site Selection
We selected Banff National Park as the location of study as it includes both the TCH and the CPR. There were a total of three locations chosen, all of which include two different study sites, road (R1) and railway (R2). The three locations were selected within ~3km of each other. Accumulatively, across all three study locations, there are a total of six sites, three near the road (i.e. TCH) and three near the railway (CPR). Each study site contains both an auditory and visual deterrence mechanism. Since our study is looking at the effectiveness of wildlife deterrence mechanisms we ran each of the four deterrence types: control (C), auditory (A), visual (V), and a combination of both auditory and visual (AV) on a daily cycle. The first day of each month the auditory deterrent was used, the second day the visual deterrent was used and the third day the combination of both auditory and visual deterrent was used. Additionally, there was a fourth day where no deterrents were used, this was the control replication. This cycle repeated after the fourth day so that all deterrents were used on different days of the week throughout the duration of the study.
|
3-D Video of project design
|
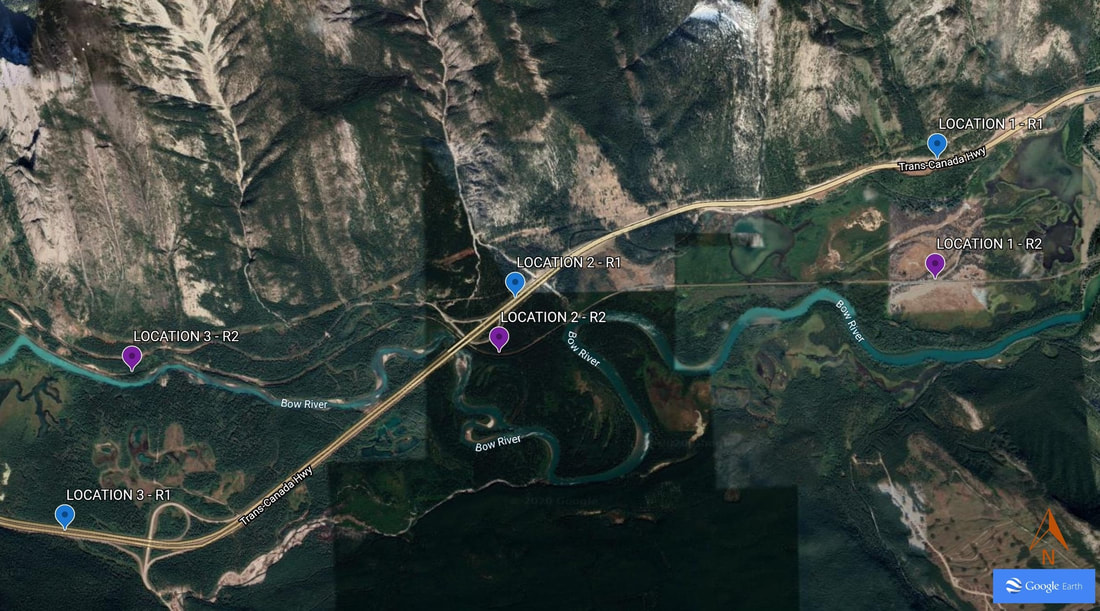
Still image of project design
|
Both a visual and auditory deterrent were set up on a pole at each site. Each deterrent was set up on the same pole so that the location remained consistent. Each day the deterrent was needed, it would be turned on for the duration of the day. On the fourth day, no deterrents were turned on as this was the control day. The auditory deterrent sends out set frequencies that are measured in kHz, with intentions for the wildlife to not only detect the sound but also respond to it (Seamans, 2013). Although there are many different visual deterrents, we chose to use a flashing light as many studies have seen success in large mammals with this type of deterrent (Schmelzeisen, 2004). Wildlife activity at each site in response to the given deterrent enabled was measured using motion-sensing wildlife cameras.
Data Collection
Collection of data was done through the placement of various motion censored wildlife cameras (trail cameras) to record presence or absence of wildlife at each study site in reference to each of our four deterrence types. In order to determine the effectiveness of each deterrent type, we collected data on wildlife activity “before” (B) and “after” (A) the deterrence mechanisms were activated. The ‘before’ data was collected from March 1, 2018 to October 28, 2018 at each of the six study sites, as a standard to base our findings on, therefore no deterrents were applied during this time. Then the ‘after’ data was collected from March 1, 2019 to October 28, 2019 with the deterrence mechanisms enabled. Overall there are a total of 448 testing days; 224 for the before measurements and 224 for the after measurements. We chose to exclude the 29th-31st of each month from March to October (if applicable) in order to keep the four day deterrence rotation equal across each month and to ensure that each deterrent had a total of 7 days of testing each month to avoid any bias towards one deterrent over another. We selected the study duration times based on the seasons in which wildlife are most prominent. The spring, summer, and fall seasons experience the most wildlife and would give us enough information to infer if the deterrents made a difference or not. We thought it was most fitting to monitor all three seasons as to ensure accurate data and true results.
